Many traders like trading VIX derivatives, expecting a big move, however these products typically have a 'drag' because of having to use other derivatives (like Futures) to track the VIX (see bottom chart). The premium for the Calls are typically pretty high as well, so overall it's really difficult to make money trading these products, since there are so many odds against you. Also I think, because everyone is trying to do the same trade!
Here are a few of the popular symbols:
VXX, UVXY, TVIX, and more
XIV, SVXY and more -inverse
And here are some relative performance charts... (from the Feb highs)
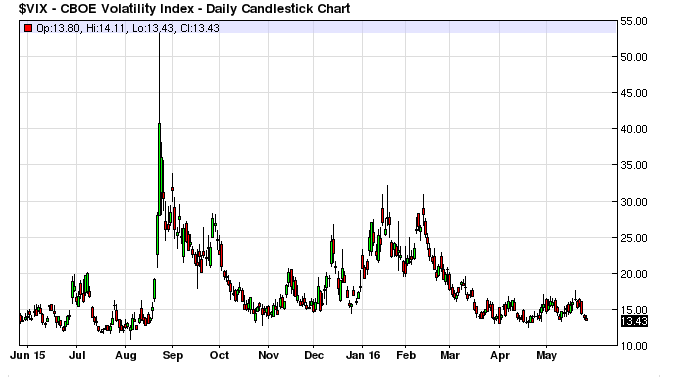
...VIX from 30 to around 13.50

...VXX from 30 to around 14

...UVXY from 60 to around 11.50
And here is a longer term view of VIX vs VXX... 3 yrs
Here you can really see the drag in performance of the VXX, and how it loses value over time, regardless of the VIX levels.

Shorting the VIX: The Best Inverse VIX ETFs