Thursday, November 3, 2016

FB Options, post earnings

FB just reported earnings yesterday, and the stock dropped around 5%
Here is an example of how you can use Options to structure a new trade on FB
Implied Volatility is still high today, so premiums are good.

This is NOT a trade recommendation, and is only for illustration and educational purposes.


Selling January 115 Puts for 3.25 (naked)
Selling twice as many Call spreads for $1.50
Total collected is the combined dollar/quantity amount.


This trade should only be done if you don't mind owning Facebook at 115, less the total credit collected. This is the downside risk.

The upside risk would be the Call spread risk,  minus the 3.25 collected from the Puts.

You could also look at the numbers for December (43 DTE) -you'll get paid faster!
And you could also analyze different ratios, and different strikes.
This is simply to illustrate how to take advantage of high implied volatility, in a somewhat neutral trade,

Another example would be to do an Iron Condor, which is the same trade, but with a Long Put to limit the downside risk and the margin requirement. Of course in this case, you would also not have the risk of being assigned the stock at a discounted price.


Monday, September 5, 2016

All time highs for Stocks

Current markets at all time highs, except for the Small Caps (Russell 2000)...
(click images to enlarge)


Small-caps -almost at the all time high!


Bonds seem to have followed stocks too! Normally its the inverse...


Tuesday, May 24, 2016

Low Implied Volatility

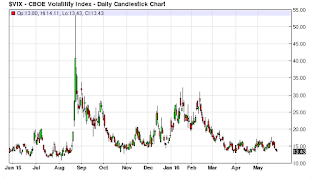
The VIX continues to hang around pretty low levels... here is a 1 year chart.

Many traders like trading VIX derivatives, expecting a big move, however these products typically have a 'drag' because of having to use other derivatives (like Futures) to track the VIX (see bottom chart). The premium for the Calls are typically pretty high as well, so overall it's really difficult to make money trading these products, since there are so many odds against you. Also I think, because everyone is trying to do the same trade!

Here are a few of the popular symbols:
VXX, UVXY, TVIX, and more
XIV, SVXY and more -inverse

And here are some relative performance charts... (from the Feb highs)

...VIX from 30 to around 13.50


...VXX from 30 to around 14


...UVXY from 60 to around 11.50


And here is a longer term view of VIX vs VXX... 3 yrs
Here you can really see the drag in performance of the VXX, and how it loses value over time, regardless of the VIX levels.


Shorting the VIX: The Best Inverse VIX ETFs