Markets seemed to be at extreme levels as of the end of August, based on a
number of metrics, but particularly the RSI, which had previously risen above
the 70ish level only one time in June, since the March bottom. Of course we also
saw those high RSI levels in Jan 2020 (coincidentally just before the Covid
disaster).
Time will tell, but it could be that the post Labor Day rally is the new 'top'
in the markets for now. This happened right afer the stock splits of AAPL & TSLA
on Sep 1st. On Sep 3rd we saw the first big market drop.
If this is in fact the start of a bigger drop, here are some charts of a few popular stocks that have
seen big rallies in recent times, and some potential target levels. Target
levels can be determined a number of ways, including the 50MA (or other moving
average of your choice), and prior breakout/support levels. FAANGs Banks Others
As this is being written, it is Fed day today, and tonight the market is selling
off once again (below).


 Japan
Japan DAX
DAX S&P
S&P DOW
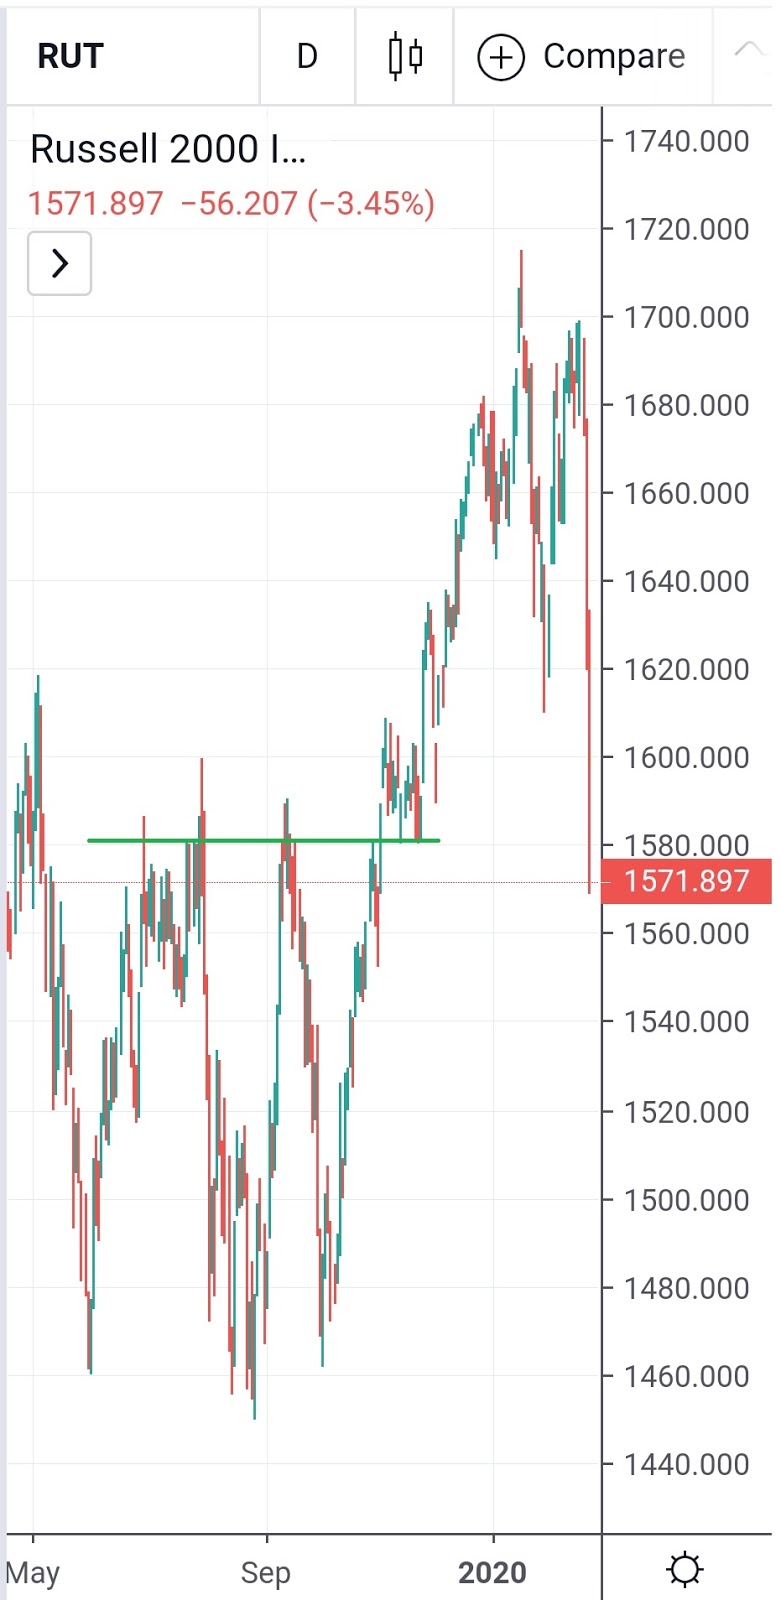
DOW Small Caps
  Financials
 Energy